When making a new commerce website proposal, the deliverables will depend on the specific requirements of the project.

However, some common deliverables that may be included in a website proposal are:
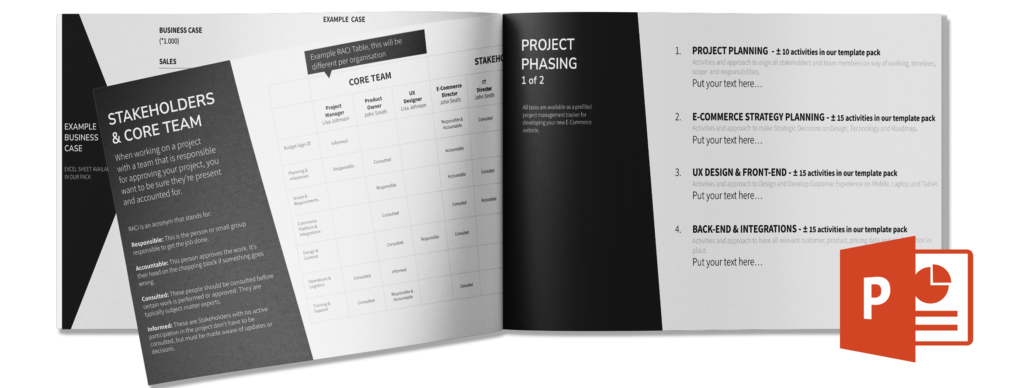
- A detailed project plan that outlines the goals, tasks, and timeline for the project
- A functional specification document that outlines the functional requirements of the website
- A design specification document that outlines the visual design of the website
- A prototype or wireframe of the website
- A project schedule that outlines the timeline for completing the project
- A budget and resource plan that outlines the cost and personnel required for the project
- A risk management plan that identifies potential risks and outlines strategies for addressing them
- A testing and quality assurance plan that outlines the process for testing and ensuring the quality of the website
- A launch plan that outlines the steps for launching the website and making it available to users.
The specific deliverables for a new website proposal will depend on the scope and requirements of the project. It is important to clearly define the deliverables in the proposal in order to ensure that all stakeholders have a clear understanding of what will be provided.
Making a Gantt Chart Timeline plan
A Gantt chart is a type of bar chart that is commonly used in project management to visually represent the project schedule and the tasks involved. In an e-commerce project, a Gantt chart could be used to track the progress of tasks related to the development and maintenance of an online store, such as designing the website, setting up payment processing, adding products to the catalog, and marketing the store to customers.
Below is the Timeline Planning made with my Project Management Template Pack for Jira.
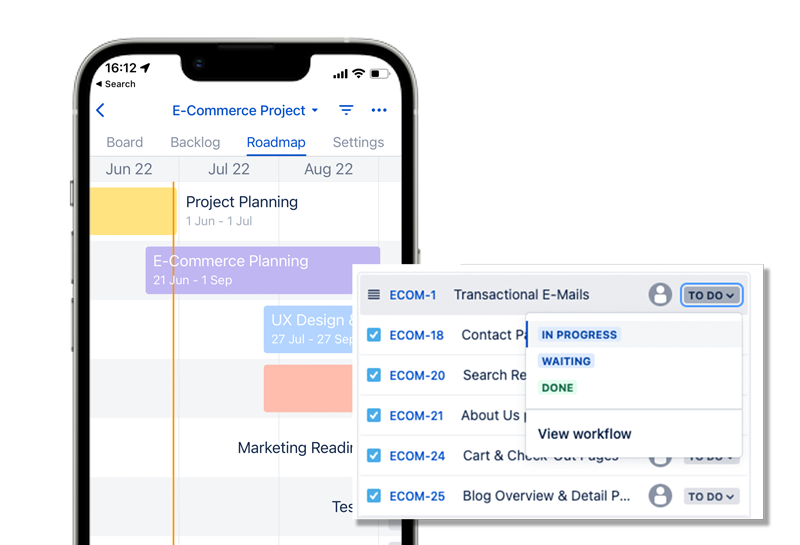
A Gantt chart typically includes a horizontal timeline across the top, with vertical bars representing each task. The length of the bar indicates the duration of the task, and the position of the bar along the timeline indicates when the task is scheduled to start and end. Gantt charts can also show dependencies between tasks, so that you can see which tasks need to be completed before others can begin.
Gantt charts are useful tools for project management because they provide a clear visual representation of the project schedule, making it easier to see how all the tasks fit together and identify potential bottlenecks or delays. They can also be used to track the progress of tasks over time, allowing project managers to see at a glance which tasks are on track and which are falling behind.